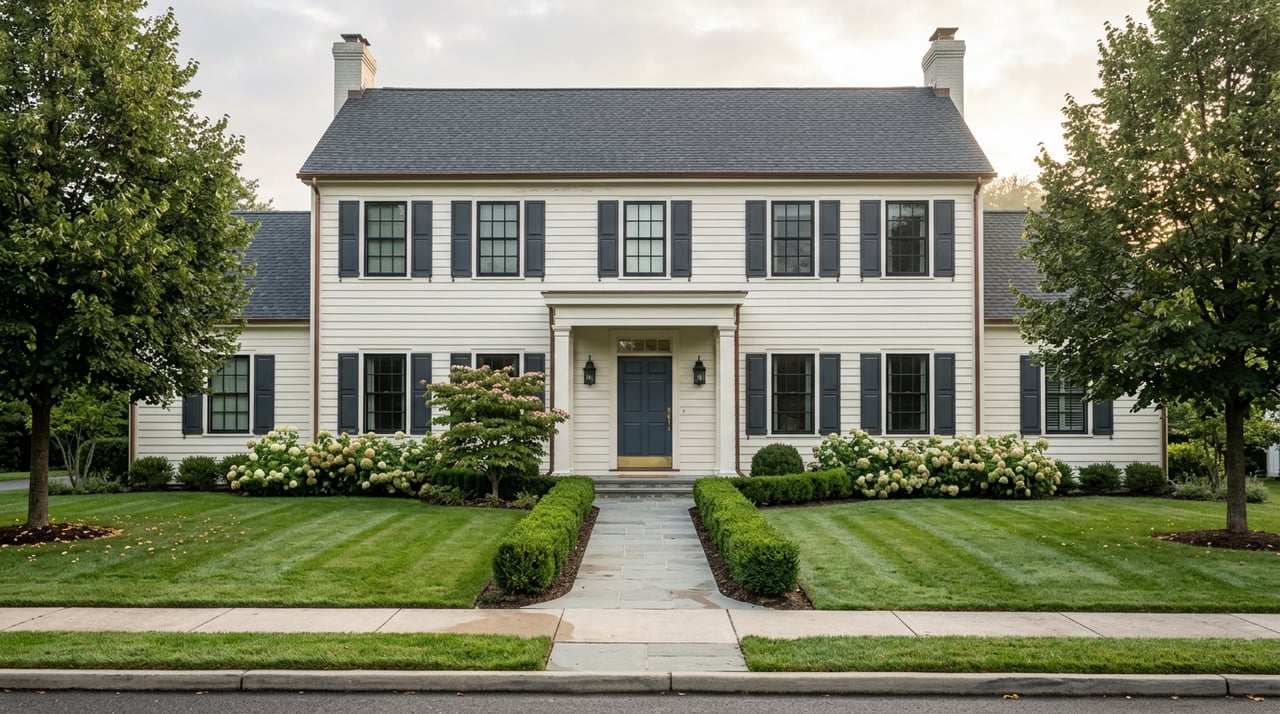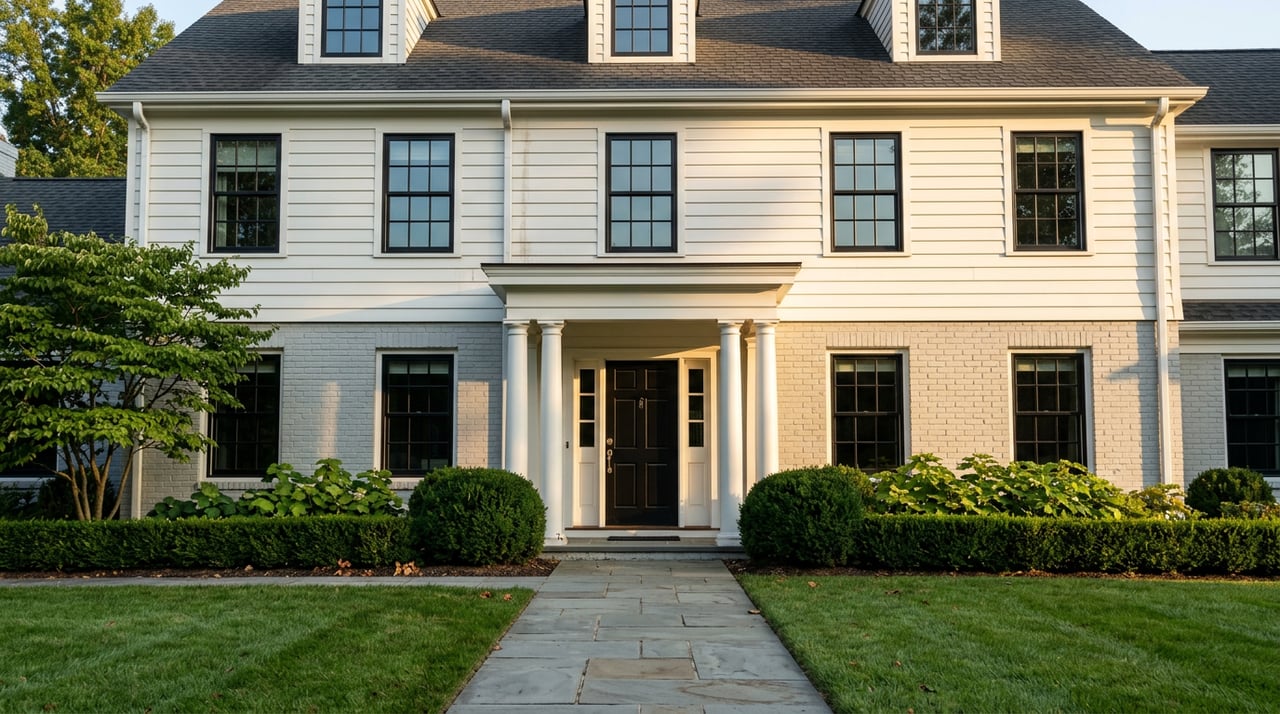
Pull up Redfin, Zillow, Realtor.com, and a local MLS-based market report side by side for Massapequa this week and you will get four different numbers, all labeled the same way: median home price. One might say the high $600,000s. Another might say the high $900,000s. A buyer trying to figure out if an offer is fair, or a seller trying to figure out what to list at, is left holding four numbers and no way to know which one describes the house they actually care about.
None of the four is wrong. That is the part most explainers skip. Each site is measuring something different, pulled on a different schedule, sometimes from a sample small enough that a single sale can move the whole town's number. Once you know what each figure is actually counting, the disagreement stops being confusing and starts being useful.
Same Town, Four Numbers
Here is what four sources were showing for Massapequa in 2026, and what each one is actually built to measure:
| Source and window | Number reported | What it's actually counting |
|---|---|---|
| Redfin, October 2025 monthly close | $881,000 median sale price | Only 8 homes closed that month, down from 19 a year earlier |
| Redfin, recently-sold snapshot (data as of early July 2026) | $980,000 median listing price among 102 recently sold homes | The asking price tied to recent closings, not the closed sale price itself |
| Zillow, current typical home value | $675,231 (Zillow Home Value Index) | A smoothed index estimating typical value across the whole housing stock, not a closed sale |
| Realtor.com, 2026 | $849,999 median list price vs. $797,500 median sold price | Two separate figures: what sellers ask and what buyers actually pay |
| EXIT Realty Premier, MLS-sourced report for March 2026 | $762,500 median sold price vs. $909,000 median active list price | The month's actual closings vs. what's currently sitting on the market |
Look at that last row for a second. One report, pulling from the same OneKey MLS data set, produces two numbers that are $146,500 apart depending on whether you're asking what sold or what's for sale. That gap alone explains a good chunk of why portal numbers never seem to agree. They are not disagreeing about Massapequa. They are answering different questions.
Why Eight Sales Can Swing a Median
The Redfin figure from October 2025 is worth sitting with. Only 8 homes closed in Massapequa that month, down from 19 the year before. When a median is built from 8 transactions, one high-end estate sale or one distressed fixer-upper does not just nudge the number, it can define it. That is a statistics problem, not a market problem, and it is the main reason a town's reported median can jump or drop by tens of thousands of dollars month to month without anything actually changing on the ground.
Compare that to Massapequa Park, a separate village next door, where Redfin's three-month window ending in May 2026 showed 25 homes sold at a median of $835,000, up 6.6% year over year, with a price per square foot of $493. Twenty-five sales over three months produces a steadier read than 8 sales in one month. Neither number is more honest than the other. One is just built on a bigger sample.
This is the part sellers feel directly. If your home is about to be one of only a handful of closings that month, the town-wide "median" printed on a portal that week has very little to do with what your specific house is worth. It is describing whatever mix of homes happened to close, not your street, your square footage, or your condition.
One Name, Three Different Markets
"Massapequa" on a search bar also blends submarkets that behave nothing alike. North Massapequa, tracked separately by Redfin, showed a median sale price of $780,000 in March 2026, up a modest 2.0% year over year, but homes there took 42 days to sell on average, twice as long as the year before. Massapequa proper, over the same broad window, was still closing homes in 14 to 20 days. Massapequa Park, a distinct incorporated village with its own tax structure and its own market, was posting an 18-day average with a much higher price per square foot.
Three neighborhoods, three timing profiles, all sitting inside what a portal search box treats as one "Massapequa." When a buyer sees a town-wide median and a town-wide days-on-market figure, they are looking at an average of markets that move at completely different speeds. A buyer targeting North Massapequa should expect a slower, more negotiable process than the headline number suggests. A buyer targeting Massapequa proper should expect the opposite.
The Number Built for Pricing a House, Not Browsing One
Of the figures above, the EXIT Realty Premier March 2026 report is the one built specifically for pricing decisions rather than casual browsing. It reported 2.13 months of inventory, a median sold price of $762,500, homes closing at 102.4% of asking price, and a 32-day median time on market for sold homes. It also tracked a separate figure, a median estimated property value of $836,980, up 9.4% year over year, which is closer in spirit to Zillow's index than to an actual closed sale.
Two numbers, one report, tracking two different things. That is not sloppiness. It is the same distinction Zillow and Redfin draw between "typical value" and "sale price," just made visible inside a single local document instead of across four websites.
Set against Nassau County as a whole, where the median single-family sale price reached $849,000 in March 2026 with inventory running 16.7% below March 2025 levels, Massapequa's $762,500 closed median actually sat below the county figure that month, even as its estimated value climbed nearly 10% for the year. A buyer glancing only at the county number might assume Massapequa is pricier than it was that month. A seller glancing only at the estimated-value figure might assume their home is worth more than what recently closed nearby. Both readings are technically accurate. Neither is the whole picture.
What This Means If You're Pricing an Offer or a Listing
If you are about to write an offer or set a list price, the number that matters most is the closed-sale median for your specific pocket of town, over as wide a window as you can get, sourced from the MLS rather than an index. A few questions worth asking whoever is guiding you through the process:
- Is this figure a closed sale price, a list price, or an estimated value?
- How many transactions is this median actually built from, and over what window?
- Does this number include North Massapequa, Massapequa proper, and any waterfront pockets together, or is it isolated to a comparable stretch of homes?
A portal number is a fine starting point for curiosity. It is not a substitute for a comparable-sales pull that matches your street, your lot size, and your finish level.
A Few Questions Worth Asking
Which number should I trust when I'm making an offer? Lean on the closed-sale median from an MLS-sourced report over the widest reasonable window, not a list price, an index value, or a single thin month of closings.
Why did an online estimate for my house change so much between visits? Index-based values like Zillow's typical home value are recalculated monthly and smoothed across a wide data set. They shift as nearby sales feed in, which is different from your home being formally reappraised.
Is Massapequa or Massapequa Park more expensive? As of the windows above, Massapequa Park's three-month median through May 2026 ran higher on a per-square-foot basis, while Massapequa proper's town-wide median moved more depending on which single month you check, a difference tied to sample size as much as to actual value.
Numbers like these are only useful once you know what they're counting. If you're weighing a move within Massapequa, comparing it to Massapequa Park, or trying to figure out what your own home is actually worth in the current market, Christine Biordi can walk you through the comparable sales that matter for your specific street, not just the headline figure on whichever site you happened to open first.